.
Taking Action on Air Quality
.
This program involves three core steps:
- Step 1: Learn about the issue of poor air quality, how it is measured, and explore our maps to improve your understanding about variations in air quality.
- Step 2: Learn more about what EY and Earthwatch are doing together to address the issue.
- Step 3: Identify solutions that can help individuals and communities, including those who are most vulnerable, to reduce exposure to polluted air. Create and share your personal actions.
.
.
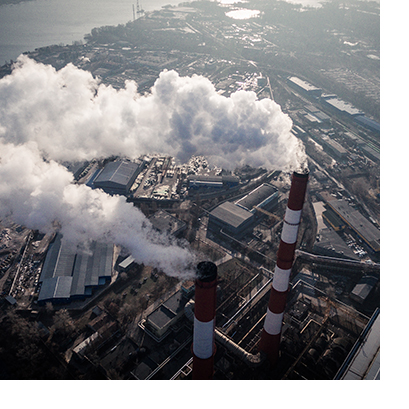
Climate Change and Air Pollution
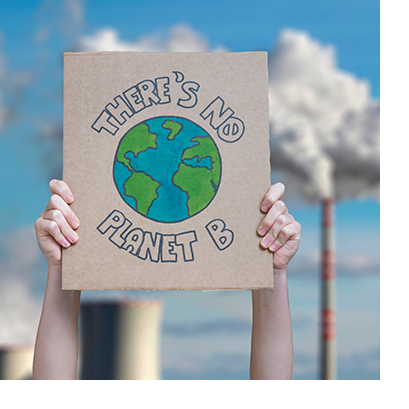 Air quality issues are intimately related to climate change. Our resource-intensive lifestyles and systems generate climate-warming greenhouse gases and air pollutants that negatively affect human health. Today, our climate is warming at increased rates. One such culprit is a phenomenon known as the greenhouse effect. When greenhouse gases (think carbon dioxide, methane, etc.) are emitted, the sun’s heat gets trapped, which warms ground-level ozone. Furthermore, as temperatures continue to rise, it increases chemical reactions that accelerate this process. As the climate warms, the Earth experiences more extreme weather events, such as heat waves, droughts and wildfires that release black carbon into the atmosphere, again further warming the planet and undermining local air quality. The complex interaction between air pollution and climate change presents a major challenge for environmental protection efforts, but it also offers the potential for common solutions.
.
.
To learn more about Climate Change and Air Pollution, check out these links:
- United Nations Environment Program: “Air pollution and climate change: two sides of the same coin”
- US Centers for Disease Control and Prevention: “Climate Change Decreases the Quality of the Air We Breathe”
- University Corporation for Atmospheric Research: “Air Quality and Climate Change”
- US Environmental Protection Agency: “Air Quality and Climate Change Research”
.
.
Understanding Air Pollution
.
 Air pollution is ranked as one of the most serious environmental threats to human well-being. One type of air pollution is particulate matter (PM), a mixture of solid particles and liquid droplets in the air that come in a variety of sizes. PM 2.5, or particles 2.5 microns in size, are so small that they can be inhaled unknowingly and can cause serious health problems (fine PM pollution is responsible for millions of deaths annually). About 90% of people globally are exposed to unhealthy air and this exposure disproportionately impacts low-income communities and communities of color, which are more often located near pollution sources.
.
.
To learn more about Air Pollution and Particulate Matter, check out these links:
- US EPA: “Particulate Matter (PM) Basics”
- Natural Resources Defense Council: “Fossil Fuel Air Pollution Kills One in Five People”
- World Health Organization: “Air Pollution”
.
.
The Air Quality Index
An air quality index is used to report air quality around the world. Different countries use different air quality indices corresponding to different national air quality standards. The most commonly used index is the Air Quality Index (AQI) which was developed by the United States Environmental Protection Agency. The AQI, noted below, is divided into six categories indicating increasing levels of health concern.
AQI values that are at or below 100 are generally thought of as satisfactory. When AQI values are above 100, air quality is unhealthy.
|
Daily AQI Color |
Levels of Concern |
Values of Index |
Description of Air Quality |
|
Green |
Good |
0 to 50 |
Air quality is satisfactory, and air pollution poses little or no risk. |
|
Yellow |
Moderate |
51 to 100 |
Air quality is acceptable. However, there may be a risk for some people, particularly those who are unusually sensitive to air pollution |
|
Orange |
Unhealthy for Sensitive Groups |
101 to 500 |
Members of sensitive groups may experience health effects. The general public is less likely to be affected. |
|
Red |
Unhealthy |
151 to 200 |
Some members of the general public may experience health effects, members of sensitive groups may experience more serious health effects. |
|
Purple |
Very Unhealthy |
201 to 300 |
Health alert. The risk of health effect is increased for everyone. |
|
Maroon |
Hazardous |
301 and higher |
Health warning of emergency conditions: everyone is more likely to affected/ |
Several AQI systems exist around the world that each look at the concentration and corresponding health impacts. In Canada it’s called the Air Quality Health Index (AQHI), in Europe it’s called the Common Air Quality Index (CAQI), and China (mainland) and India both also calculated their own AQI.
.
.
To learn more about the Air Quality Index, check out these links:
- US EPA: “AQI Basics”
- PurpleAir Sensor Map: Real-time air quality map
- Air Quality standards in different countries: https://blog.atmotube.com/standards-for-air-quality-indices-in-different-countries-aqi/
.
.
Air Pollution and Human Health
.
Exposure to poor air quality is one of the most pressing threats to human health globally. Air pollution can lead to respiratory and heart conditions, which are both underlying health issues that have recently resulted in a significant increase in the risk of death from COVID-19.
Improving access to clean air depends on adopting practices that both reduce air pollution and help individuals to avoid polluted air. In order to achieve these objectives, it is critical to improve our ability to predict local air quality, especially in communities which are at the highest risk, and to take action to reduce emissions and avoid pollution exposure.
.
.

This map displays the variation in air quality within the Pittsburgh metro area. It shows that many communities with a high proportion of vulnerable community members, as defined by the EPA’s EJ Screening tool (the black outline), are located where air pollution is on average worse (red and orange colors) and fewer air sensors are located (green and orange triangles).
.
.
Environmental Racism and Environmental Justice
.
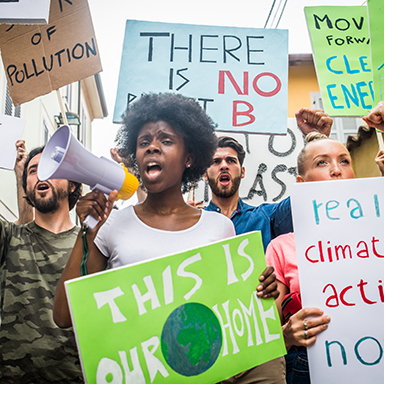 Air pollution is ranked as one of the most serious environmental threats to human health and well-being. Yet low-income communities and communities of color are more often located near pollution sources, resulting in higher levels of exposure to unhealthy air. At the same time, climate change is predicted to have disproportionate impacts on low-income, marginalized communities. By participating in this program, you will have the opportunity to contribute to air quality research while developing strategies to reduce exposure to air pollution, particularly in vulnerable communities.
Environmental racism is a concept in the environmental justice movement, which developed in the United States throughout the 1970s and 1980s. Environmental racism is a form of systemic racism whereby communities of color are disproportionately burdened with health hazards through policies and practices that force them to live in proximity to sources of toxic waste such as sewage works, landfills and emitters of airborne particulate matter.
The US EPA defines Environmental Justice as the fair treatment and meaningful involvement of all people regardless of race, color, national origin, or income, with respect to the development, implementation, and enforcement of environmental laws, regulations, and policies.
.
.

.
The image to the left was created from pollution exposure data by population from 2003 to 2015. It shows that Black and Latinx American populations are exposed to more pollution than they produce where non-Hispanic white Americans are exposed to less pollution than they produce. To read the full paper check out the link in the Learn More section.
.
.
.
To learn more about Environmental Racism and Environmental Justice, check out these links:
- Environmental Justice Screening and Mapping Tool: https://www.epa.gov/ejscreen
- Robert Bullard article: “I Wrote About This Environmental Injustice Decades Ago. It Hasn’t Changed.”
- Natural Resources Defense Council: “What is Environmental Justice”
- Columbia Law School’s Defending the Planet Podcast: “Environmental Justice”
- Julian Agyeman article: “Trends and Directions in Environmental Justice: From Inequity to Everyday Life, Community, and Just Sustainabilities”
- The New York Times article: “People of Color Breathe More Hazardous Air. The Sources Are Everywhere.”
- World Economic Forum article: “What is environmental racism and how can we fight it?”
- National Academy of Sciences article: "Inequity in consumption of goods and services adds to racial-ethic disparities in air pollution exposure.”
.
.
Exploring Air Quality Maps
.
Sample Air Quality Maps
Global Maps
- World Air Quality Index
(Beijing-based nonprofit) - Berkeley Earth Air Quality Map
- IQ Air Maps
North America
Central America
South America
Israel
- Israel Official Ministry of Environmental Protection AQ Map (more information here)
.
.
Tackling the Issue
.

.
Operation Purple Air
Earthwatch and EY have partnered together to deploy low-cost air quality monitors at College MAP Schools across the USA. These sensors, manufactured by PurpleAir, collect hyper-local real-time data on Particulate Matter (PM) also known as particle pollution. Through Wi-Fi and power, PurpleAir displays the data on an accessible open-source global map. Students, teachers, and community members can use this data to monitor local air quality information and take action to mitigate exposure.
Learn More
.

.
Operation Fresh Air
Earthwatch, EY, and the Pollitt Lab from Yale University have partnered together to deploy FreshAir Clips, a device created by Dr. Krystal Pollitt, that passively samples pollutant exposures over a 14-day sample period. The Pollitt lab team then use mass spectrometry techniques to analyze these samples for pollutants and metabolites related to air pollutant exposure. You can see Dr. Pollitt’s publications in a variety of journals at the link below and learn more about how the labs work contributes to solutions.
Learn More
.

.
Scan the Skies
In 2020, EY and Earthwatch teamed up with the Wilson Center to use app-based technologies to share images of air quality to a global air quality data set. The Global Earth Challenge App was created by Earth Day Network, the Wilson Center, and the US State Department to share data collected on an open citizen science platform. So far, EY has contributed over 2,000 observations. If you’d like to use the app, check out the initiative in the Ripples portal and don’t forget to use “EYCONNECT” as your Org Code.
Learn More
.
Earthwatch Citizen Science Air Quality
This interactive map displays Earthwatch and EY citizen science projects related to air quality. This includes observations made through the app-based “Earth Challenge” photo project, as well as Purple Air sensors and passive FreshAir Clips—deployed by EY employees. Using the tools on the left side of the screen, you can view details about the data and methodologies used to generate this map. You can also toggle between data layers, turning data sets on and off—enabling you to focus on specific layers of interest (click on the three stacked squares).
.
.
Success Stories
Keep the momentum going!
.
.
.
Create and Share Your Action Plan
Once you register to participate in the “Healthy Planet, Healthy People: Air Quality” initiative on the EY Ripples Portal, you will be sent an automated email with further instructions to complete an action plan. Please complete the action plan and email it to Alexandra Blair (Alexandra.E.Blair@ey.com), a member of EY’s Americas Corporate Responsibility Team. EY’s Americas Corporate Responsibility and Earthwatch Institute will review Action Plans and select winners from each region. The links below with further instructions are included in the automated email.
.
Resources
Global Earth Challenger User Guide
Action Plans in Non-English Languages
Español
Action Plan Template (Español)
Sample Personal Action Plan (Español)
Sample Business Action Plan (Español)
Português
Action Plan Template (Português)
Sample Personal Action Plan (Português)
Sample Business Action Plan (Português)
Français
Action Plan Template (Français)
.